
Job Openings and Labor Turnover, March 2025
By Lainey Stalnaker, Data Analytics Writer

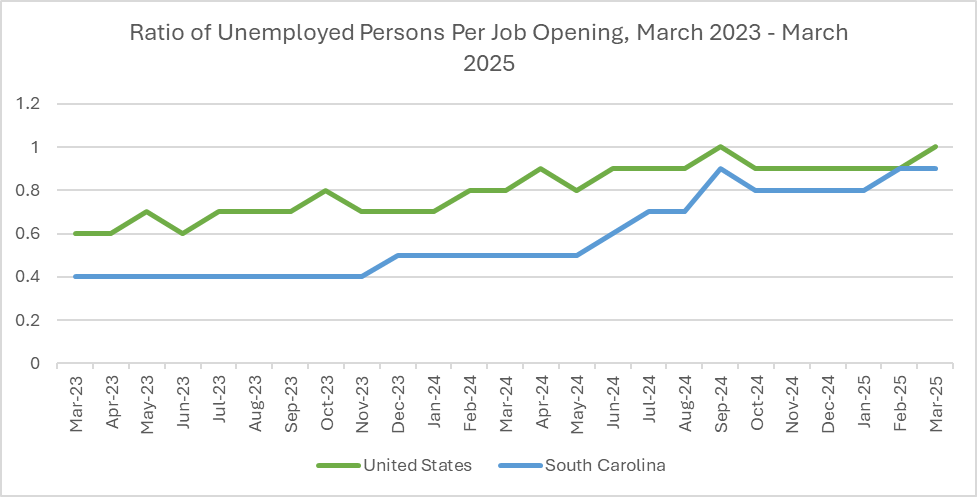
The Job Openings and Labor Turnover Survey (JOLTS), released monthly by the Bureau of Labor Statistics (BLS), provides essential information on South Carolina’s labor market.[1] In March of 2025, South Carolina’s job openings per unemployed persons ratio was 0.9, just below the national average of 1.0. Though South Carolina’s ratio has nearly doubled in the last year, it still remains historically low, underscoring the continuing strength of the state’s job market.
The table below compares unemployed persons per job opening ratios in the Southeast Region.[2] There is less than one unemployed person per job opening in all states in the region except Kentucky.
| Regional Job Openings ratios | ||||||||
KY | TN | NC | SC | GA | FL | AL | MS | ||
| MARCH 2025 | 1.1 | 0.7 | 0.8 | 0.9 | 0.7 | 0.9 | 0.7 | 0.8 | |
| MARCH 2024 | 0.7 | 0.6 | 0.7 | 0.5 | 0.6 | 0.7 | 0.6 | 0.5 | |
Other key statistics released in the monthly JOLTS report include:
- Job openings rate: the number of positions open during the month as a percentage of all jobs and job openings.
- Hires rate: the number of people hired during the month as a percentage of total employment.
- Separations rate: the number of people separated from their jobs during the month as a percentage of total employment. The quits rate is the proportion of people who voluntarily left their jobs, and the layoffs and discharges rate is the proportion of people who involuntarily left their jobs, which may have resulted from business closures, layoffs, downsizing, or firing for cause. Separations resulting from retirements, transfers, or deaths are included in the total separations rate.
| JOLTS Key Ratio Statistics, MARCH 2025 | ||||||||
KY | TN | NC | SC | GA | FL | AL | MS | ||
| Job Openings RATE | 4.7 | 4.7 | 4.8 | 4.6 | 5.1 | 4.1 | 4.7 | 4.9 | |
| HireS Rate | 3.6 | 3.7 | 3.0 | 4.0 | 3.7 | 3.5 | 3.6 | 3.5 | |
| Total SeparationS Rate | 3.2 | 3.4 | 3.0 | 3.3 | 3.3 | 3.4 | 3.2 | 3.2 | |
| QuitS Rate | 2.0 | 2.3 | 2.0 | 2.3 | 2.2 | 2.4 | 2.2 | 2.1 | |
| LayoffS Rate | 0.9 | 0.9 | 0.9 | 0.8 | 1.0 | 0.8 | 0.9 | 0.9 | |
In March of 2025, the job openings rate fell across the Southeast region, and South Carolina had the second lowest rate at 4.6. Two factors likely contributed: the total number of job openings was down by 3,000 from the month before, but payroll employment increased, which together would have reduced the number of openings as a percentage of all jobs.
Hiring was also down, but South Carolina nevertheless had the highest hires rate in the region. Hires exceeded separations again this month, meaning members of the labor force were more likely to enter into employment than to be separated from it. The layoffs rate and quits rate both fell, pointing to lower turnover overall.
[1] https://www.bls.gov/news.release/jltst.nr0.htm
[2] The Southeast Region is defined by the Department of Labor and includes Alabama, Georgia, Florida, Kentucky, Mississippi, North Carolina, South Carolina, and Tennessee.