Quarterly Census of Employment and Wages: Quarter Three, 2025

By Lainey Stalnaker, Data Analytics Writer
The Quarterly Census of Employment and Wages (QCEW) measures changes in employment, establishments, total wages, and average weekly wages at the national, state, and county levels.[1] Data are categorized by sector according to the North American Industry Classification System (NAICS). These data include the monthly employment and quarterly wages for workers covered by state unemployment insurance (UI) laws and federal workers covered by the Unemployment Compensation for Federal Employees (UCFE) program, absent certain excluded groups.
Between quarter three of 2024 and quarter three of 2025, South Carolina recorded strong wage growth. Average weekly wages increased in 43 of 46 counties in the state and in all but one sector. Employment was also up over the 12-month period—by nearly 16,000.
Wages by County
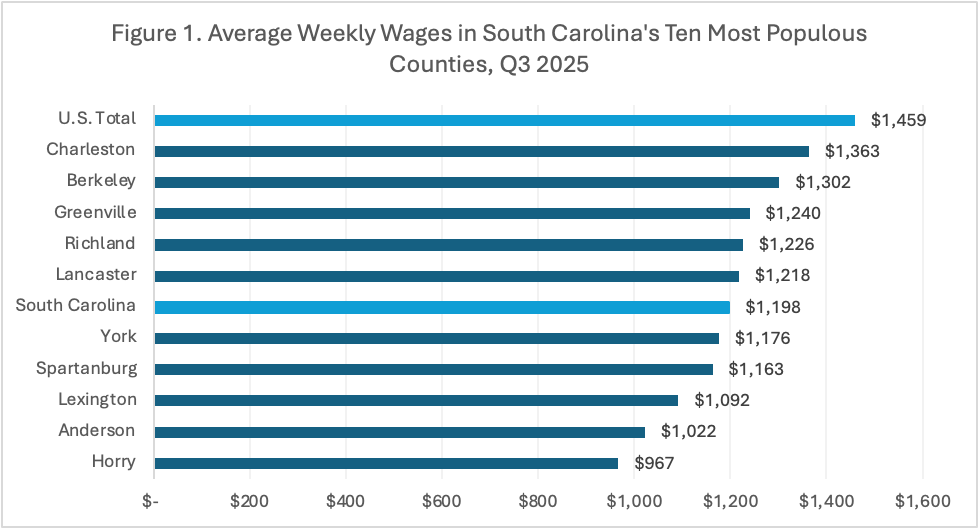
During quarter three of 2025, average weekly wages in South Carolina were $1,198, up 4.9 percent, or $56, from one year earlier. Wages grew fastest in Union County, increasing 7.1 percent from $907 to $971. Spartanburg, Charleston, Jasper, and Florence Counties followed. A total of 18 counties in the state outpaced the U.S. average wage growth of 4.7 percent.
Average weekly wages in South Carolina’s ten most populous counties are shown in Figure 1, below. Across all counties, wages were highest in Charleston County at $1,363, followed by Berkeley County at $1,302 and Aiken County at $1,252. Greenville, Lancaster, and Richland Counties also exceeded the state average for weekly wages.
Employment by County
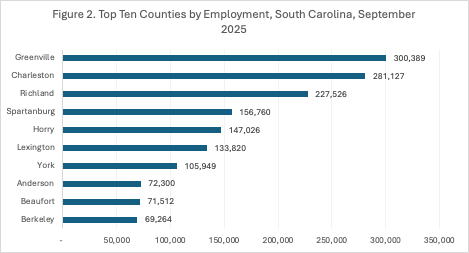
In September 2025, employment was highest in Greenville County, exceeding 300,000 workers. Charleston County came second at 281,127, followed by Richland County at 227,526. Annual changes in employment were mixed across the state. A total of 23 counties reported an increase in employment, while 23 reported a decline.
The fastest employment growth occurred in Fairfield County at 5.9 percent, followed by Jasper County at 3.3 percent and Kershaw County at 3.0 percent. The ten counties with the highest total employment in September 2025 are shown in Figure 2.
Wages by Sector
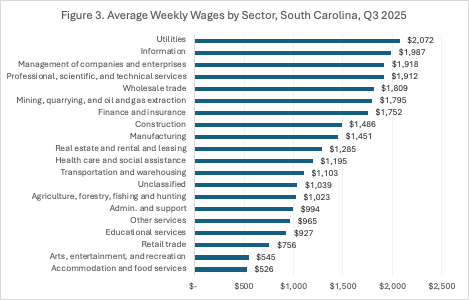
Wages were highest in the utilities sector, averaging $2,072 per week during quarter three of 2025. This was an increase of $149 compared to 12 months ago. The information sector had the second highest average weekly wages at $1,987. This sector recorded a 10.8 percent increase in wages, which was the fastest of any in the state and accounted for an additional $193 per week. In third place, management of companies and enterprises recorded average weekly wages of $1,918. Wages increased in all but one sector: real estate and rental and leasing. Average weekly wages for each sector are shown in Figure 3.
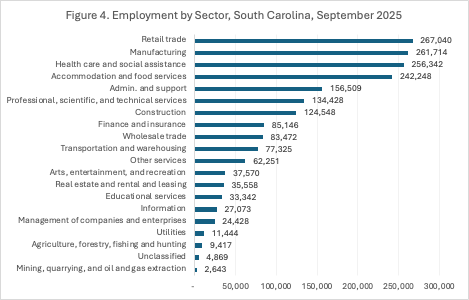
Employment by Sector
In September of 2025, employment was highest in the retail trade sector, which employed 267,040 people. In second place, the manufacturing sector employed 261,714 people. The health care and social assistance sector employed 256,342 people. Figure 4 shows employment in each sector.
Health care and social assistance recorded the largest increase in employment, adding 9,053 jobs over the year and accounting for 57 percent of overall job growth in the state. Growth was also high in the construction sector, which added 5,497 jobs, and the finance and insurance sector, which added 2,076 jobs. Ten sectors recorded declines in employment. Most notably, the transportation and warehousing sector lost 2,996 jobs, or 3.7 percent of total employment. Despite these losses, gains in other sectors were large enough that overall employment increased in South Carolina by 0.7 percent over the 12-month period.