
Understanding State Employment and Unemployment

By Lainey Stalnaker, Data Analytics Writer
Each month, the Bureau of Labor Statistics (BLS) publishes state employment and unemployment data, which include labor force statistics such as the unemployment rate, the size of the labor force, and employment numbers by industry sector. These data are estimates, and may be subject to sampling errors. To account for this, BLS adjusts its estimates annually through a process called benchmarking. This article provides an overview of how state employment and unemployment estimates are initially produced and then later revised.
How are employment estimates produced?
The Current Employment Statistics (CES) survey is a monthly payroll survey of approximately 121,000 businesses and government agencies. The CES State and Area program uses this survey to produce estimates of employment, hours worked, and earnings for states and major metropolitan areas.[1] Data are also aggregated at the industry level. CES program estimates are published about five months after the survey reference week, meaning they are typically the most current employment statistics available.
How are unemployment estimates produced?
Because the CES survey is a survey of employers, it can only provide insight into the employed population, not the unemployed population, or those outside of the labor force. To fill this gap, the Local Area Unemployment Statistics (LAUS) program provides estimates of state and local unemployment levels and rates.
The LAUS program combines data from multiple sources to produce monthly model-based estimates of unemployment. These sources include the CES survey; the Current Population Survey (CPS), which is a monthly survey of U.S. households conducted by BLS and the Census Bureau; and state unemployment insurance (UI) systems.[2]
What is benchmarking?
We have established that monthly employment and unemployment statistics are both estimates, and the level of precision can sometimes be improved with new information. The statistics are therefore subject to annual benchmarking. This process is necessary because the initial sample may not always be a complete picture of the workforce. Lower survey response rates can reduce the quality of the sample and therefore the accuracy of the final estimate. Additionally, updates to critical inputs such as net birth-death forecast models and seasonal adjustment factors can shed new light on the data. Annual benchmarking allows BLS to adjust their initial estimates by comparing them to censuses or more comprehensive data.
CES estimates are typically benchmarked to a census of the employer population. Typically, this is the Quarterly Census of Employment and Wages (QCEW), which provides a count of establishments, employment, and wages for workers covered by state UI laws. While the CES survey samples just a small proportion of establishments in each state, the QCEW covers 98 percent of jobs in the country.[3]
LAUS estimates are revised based on updated CES data, as well as updated UI claims data and new population controls from the Census Bureau.
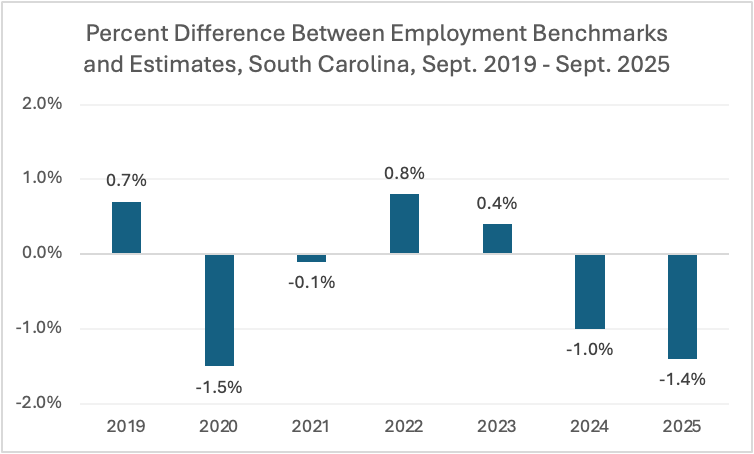
Revisions can be hard to predict, and they vary by state and sector. The graph below shows the percent difference between employment benchmarks and estimates for South Carolina for the years 2019 through 2025. Most recently, employment estimates for September of 2025 were revised down by 1.4 percent.[4] In other years, employment estimates have been revised up, meaning they were initially underestimated.
[1] https://www.bls.gov/sae/questions-and-answers.htm
[2] https://www.bls.gov/lau/lauov.htm
[3] https://www.bls.gov/cew/overview.htm
[4] https://www.bls.gov/sae/publications/benchmark-article/annual-benchmark-article.htm#RevState