MyBenefits
Apply for and certify your claim here.
 The Official Web Site of the State of South Carolina
DEW offices and SC Works centers will be closed Thursday, November 27th, and Friday, November 28th, in observance of Thanksgiving.
All offices will reopen on Monday, December 1st, and we will be happy to assist you then! Please note that unemployment payments may be delayed depending on your financial institution's holiday schedule.
S.C. business payrolls set record, unemployment rate edges up
South Carolina businesses continued to set record job levels in November with manufacturing leading the way by adding 3,800 jobs over the month.
While nonfarm payrolls grew, the state’s seasonally adjusted unemployment rate inched up to 4 percent in November from October’s rate of 3.9 percent. In the last six months, the unemployment rate has remained steady in the 3.9 percent to 4 percent range.
The number of South Carolinians working decreased over the month by 2,451 to 2,232,579 people, while the number of unemployed increased by 1,648 to 92,740. The state’s labor force in November decreased by 803 to 2,325,319 people.
Since November of 2016, the labor force has grown by 27,178 people, and employment gains totaled 34,305. The level of unemployed people decreased by 7,127.
Nationally, the unemployment rate showed no change, remaining at 4.1 percent in November.
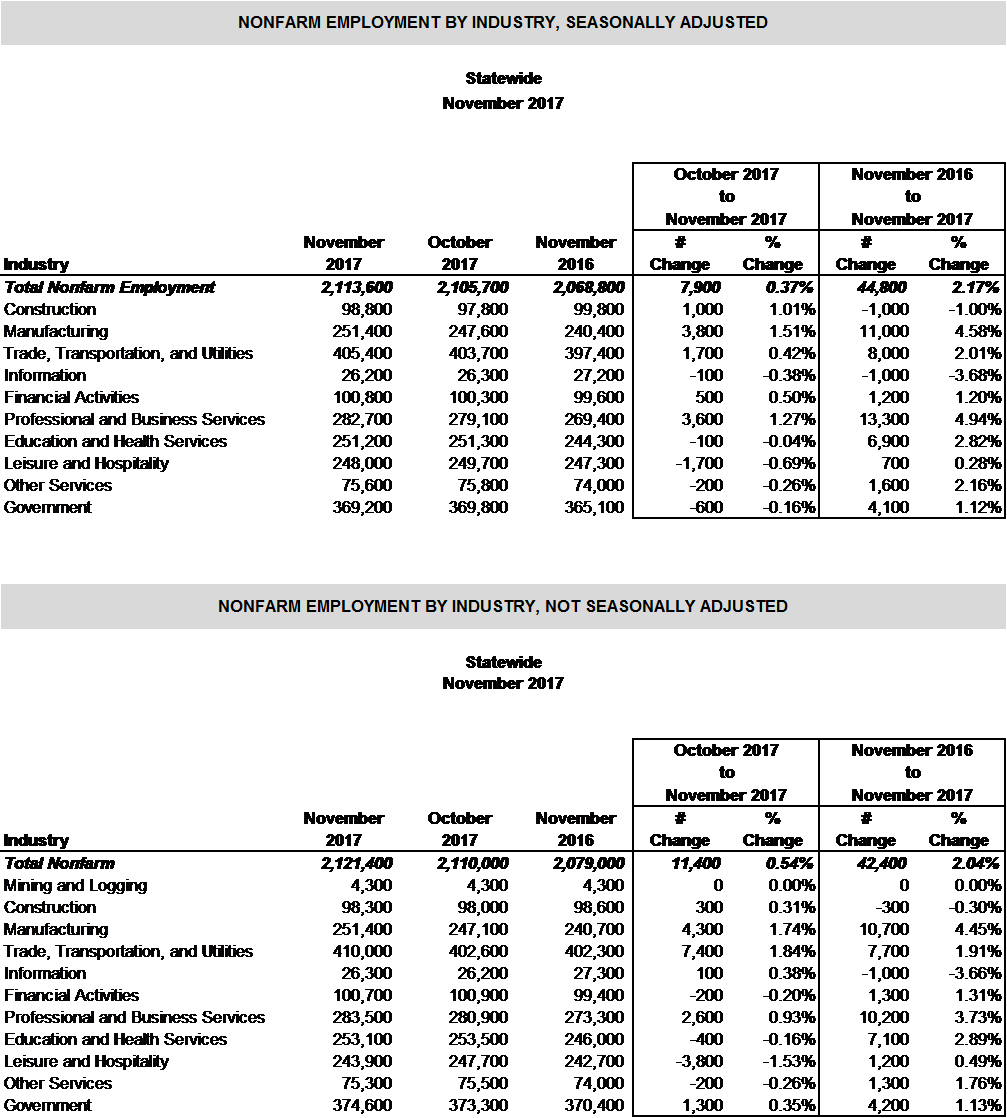
Nonfarm Employment by Industry (Seasonally Adjusted1)
November 2017 seasonally adjusted, nonfarm payrolls increased by 7,900 over the month to a record level of 2,113,600.
From November 2016 to November 2017, South Carolina’s economy has added 44,800 seasonally adjusted, nonfarm jobs.
Nonfarm Employment by Industry (Not Seasonally Adjusted2)
Not seasonally adjusted, nonfarm payroll employment increased by 11,400 from October 2017 to November 2017 for a total of 2,121,400.
Since November 2016, not seasonally adjusted, nonfarm jobs were up 42,400 overall in South Carolina.
1Seasonally Adjusted: Seasonal adjustment removes the effects of events that follow a more or less regular pattern each year (i.e. tourist-related hiring and school closings in the summer). These adjustments make it easier to observe the cyclical and other nonseasonal movements in data over time.
2Not Seasonally Adjusted: Effects of regular or seasonal patterns have not been removed from these data