Quarter Three, 2025: South Carolina Outpaces Neighbors in Year-Over-Year GDP and Personal Income Growth

By Lainey Stalnaker, Data Analytics Writer
Introduction
Two essential indicators of economic health are gross domestic product (GDP) and personal income. GDP is the market value of all final goods and services produced within a given period of time. It is calculated by adding personal consumption and investments, government spending and investments, and net exports. The greater the GDP of a country, state, or county, the larger its economy.
Personal income is income from all sources, including the typical earnings from wages and salaries, plus employer contributions to employee pension and insurance funds. It also includes income from interest, dividends, and rent (i.e., income from property or assets), and transfers from the government, such as social security or financial aid payments. Contributions to government social insurance programs are excluded.
GDP and personal income data are collected by the Bureau of Economic Analysis and published quarterly at the national and state levels.[1]
GDP
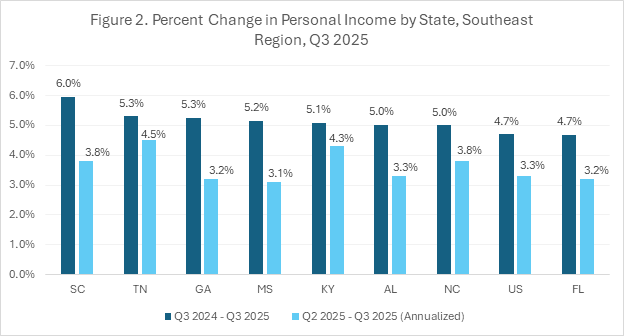
From quarter two to quarter three of 2025, South Carolina’s GDP grew at an annualized rate of 4.2 percent. The leading contributors by sector were manufacturing, which accounted for 0.75 points; retail trade, which contributed 0.53 points; and wholesale trade, contributing 0.48 points. Professional, scientific, and technical services and finance and insurance rounded out the top five.
From quarter to quarter, South Carolina ranked 32nd in the country for GDP growth, but year-over-year, South Carolina outpaced all other states. From the third quarter of 2024 through the third quarter of 2025, South Carolina’s real GDP increased 3.5 percent, the fastest in the country. National real GDP, in comparison, increased just 2.3 percent over the same period.
South Carolina’s year-over-year growth was driven primarily by the manufacturing sector, the real estate and rental and leasing sector, and the information sector. Health care and social assistance and professional, scientific, and technical services also recorded significant gains. Real GDP in all five of these sectors increased by over $1 billion over the 12-month period, and together they accounted for almost 70 percent of the state’s GDP growth.
Figure 1 shows annualized quarterly GDP growth rates for the Southeast region, as well as annual growth rates. While GDP growth from quarter two to quarter three may have lagged behind some neighboring states, South Carolina is making consistent gains in the long term.
Personal Income
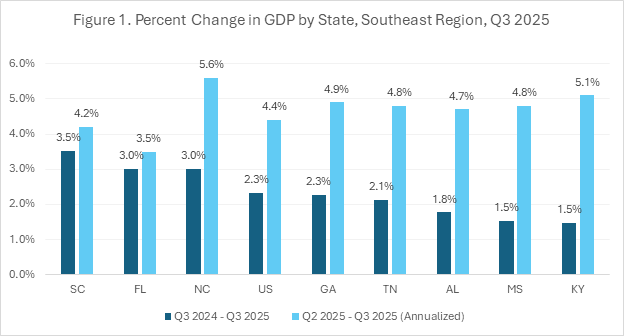
Personal income in South Carolina increased at an annualized rate of 3.8 percent from quarter two to quarter three of 2025, ranking 15th in the country. An increase in net earnings (i.e., wages and salaries) was the main contributor.
South Carolina also recorded strong personal income growth year-over-year. From quarter three of 2024 through quarter three of 2025, personal income increased 6.0 percent, the fastest in the Southeast region and tied for the fifth fastest in the country.
Year-over-year, net earnings contributed the most to overall growth of personal income, meaning personal income rose primarily as a result of increases in wages and salaries. Within the private sector industries, the largest contributors were professional, scientific, and technical services; health care and social assistance; and construction.
Figure 2 compares annualized quarterly personal income growth and year-over-year personal income growth in the Southeast region.