
Who Works in Downtown Columbia? A Deep Dive Using Census Data
By Dr. Bryan Grady, Assistant Executive Director
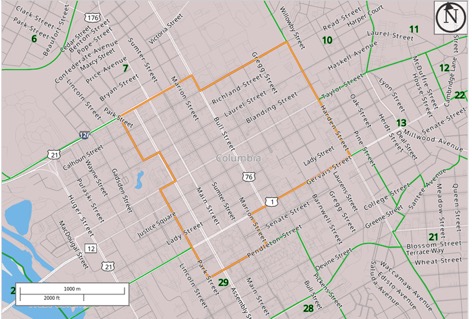
The area outlined in yellow is Richland County Census Tract 31. Out of the 1,103 tracts across the state’s 46 counties, this one has the most workers. We know this thanks to the Longitudinal Employer-Household Dynamics (LEHD) data set produced by the United States Census Bureau. LEHD matches wage records from the unemployment insurance tax system at DEW and our sister agencies nationwide to other data housed at Census, producing a rich source of information about the labor market while protecting individual privacy.
For those familiar with downtown Columbia, Tract 31 has many corporate and government office buildings, shopping and dining destinations in the Main Street district, and healthcare facilities like Prisma Health Baptist Hospital. All told, LEHD reports 37,356 jobs within the tract as of 2023. We know a little bit about the demographics of these workers, too:
- By age, 25.0 percent of workers are 55 or older; 18.5 percent are 29 or younger.
- By race, 64.7 percent are white; 31.1 percent are black.
- By sex, 59.2 percent are female; 40.8 percent are male.
In terms of human capital, we can assess the educational attainment of workers 30 or older, which is largely in line with the state overall:
- Less than high school: 11.0 percent
- High school or equivalent: 24.0 percent
- Some college or associate degree: 30.9 percent
- Bachelor’s degree or higher: 34.1 percent
We can also identify the sectors in which the workers are employed. Here are the top five, illustrating the area’s preponderance of professional jobs:
- Public administration: 26.7 percent
- Professional, scientific, and technical services: 18.8 percent
- Health care and social assistance: 12.5 percent
- Finance and insurance: 12.1 percent
- Administration, support, waste management: 9.5 percent
LEHD can also tell us where these workers live and, as a result, what commutes they have. Unsurprisingly, most of them (59.1 percent) live in Richland County or Lexington County. However, more reside in Charleston County (3.4 percent) or Greenville County (3.1 percent) than any of the other counties in the Midlands. Among home ZIP codes, the most common are:
- 29072 (Town of Lexington and surroundings): 5.2 percent
- 29229 (Lake Carolina and Sandhill areas): 4.9 percent
- 29223 (Dentsville and Northeast Columbia): 4.2 percent
- 29209 (Garners Ferry Road neighborhoods): 3.6 percent
- 29063 (Ballentine, Irmo, and points north): 3.5 percent
This analysis only scratches the surface of what LEHD data can provide to employers and local officials who want to learn more about their local workforce. We know government data can be intimidating, but feel free to email our team here at lmicustomerservice@dew.sc.gov with whatever questions you have and we’ll be happy to help.