Quarterly Census of Employment and Wages: Quarter One, 2026
By Lainey Stalnaker, Data Analytics Writer

The Quarterly Census of Employment and Wages (QCEW) measures changes in employment, establishments, total wages, and average weekly wages at the national, state, and county levels. Data are categorized by sector according to the North American Industry Classification System (NAICS). These data include the monthly employment and quarterly wages for workers covered by state unemployment insurance (UI) laws and federal workers covered by the Unemployment Compensation for Federal Employees (UCFE) program, absent certain excluded groups.
From March 2025 to March 2026, employment in South Carolina increased by 16,938 jobs, or 0.7 percent, outpacing the national growth rate of 0.1 percent. Wages increased 4.0 percent over the 12-month period.
Employment by County
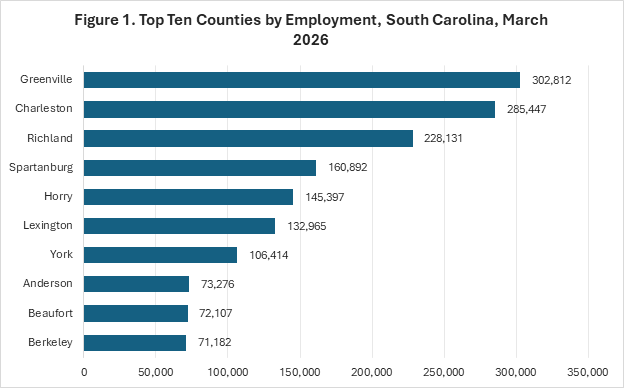
Employment increased in 26 out of 46 counties, growing fastest in Marlboro County at 4.8 percent, followed by Saluda County at 3.7 percent and Sumter County at 3.0 percent. Greenville County remained in the top spot for total employment, exceeding 300,000 jobs. The top ten counties are shown in Figure 1.
Wages by County
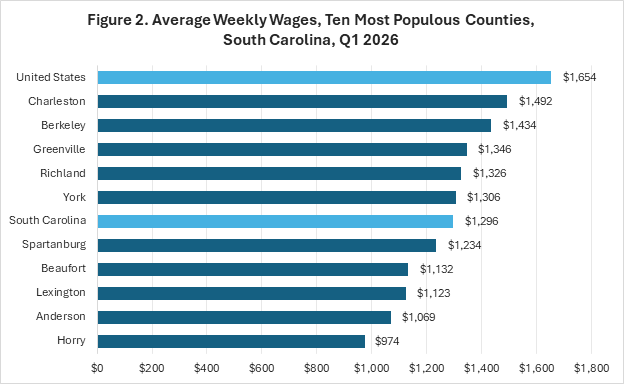
In Q1, average weekly wages in South Carolina were $1,296. Wages increased in nearly every county in the state, but were particularly high in Lancaster County, where wages increased 20.7 percent over the year. This was primarily driven by wage growth in the management consulting industry. Wage growth was also high in Allendale County at 8.5 percent, Union County at 6.4 percent, Charleston County at 6.0 percent, and McCormick County at 5.5 percent. Wages increased in all ten of South Carolina’s most populous counties. Wages in these counties are shown in Figure 2.
Employment by Sector
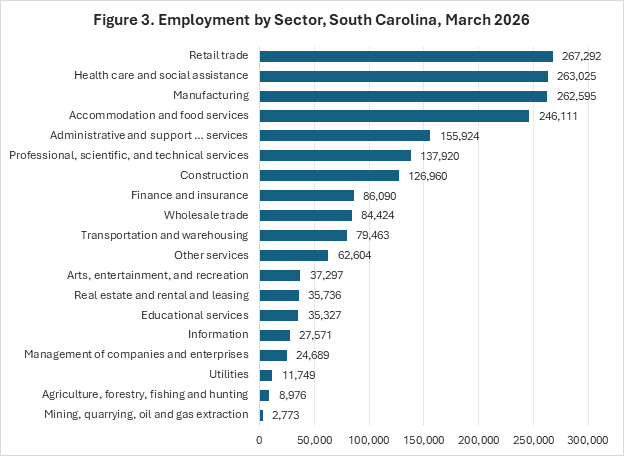
In March 2026, employment in the three largest sectors was nearly evenly split. A total of 267,292 jobs were in the retail trade sector; 263,025 jobs were in t he healthcare and social assistance sector; and 262,595 jobs were in the manufacturing sector. Employment in each sector is shown in Figure 3.
Wages by Sector
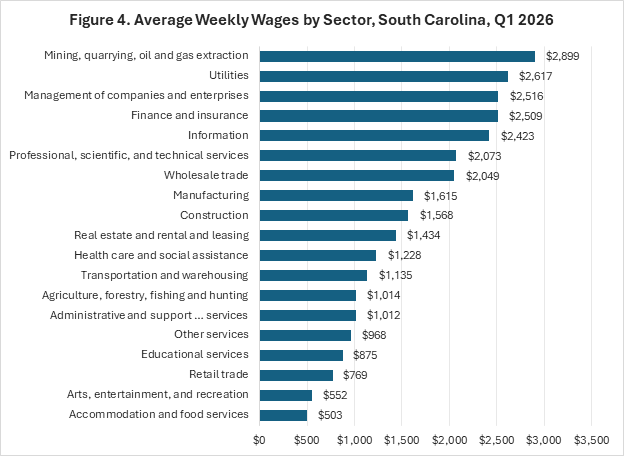
Wages were highest in the mining, quarrying, oil, and gas extraction sector at $2,899. Wages were also high in the utilities sector; management of companies and enterprises sector; finance and insurance sector; and information sector. Wages increased in every sector except wholesale trade, which recorded a drop of 5.6 percent. Average weekly wages for each sector are shown in Figure 4.